Traffic management specialists in the National Airspace System (NAS) are highly experienced and generally effective in planning and executing Ground Delay Programs (GDPs). However, GDPs are sometimes operated inefficiently, resulting in excessive delays. One contributing factor to this excess delay is under-delivery at airports. This analysis shows that, on average, actual arrival counts fall statistically below stated airport capacity during ground delay events. To address this issue, we propose a specific operational technique involving a “Blanket Adjustment” in GDP execution. Simulation-based training may improve the efficiency of GDP implementation, ultimately reducing delays for flight operators and generating cost savings for the transportation system.
I. Introduction
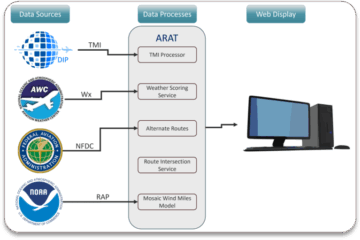
The Federal Aviation Administration (FAA) Air Traffic Control System Command Center (ATCSCC) uses the Flight Schedule Monitor (FSM) program to analyze, model, and disseminate numerous Traffic Flow Management (TFM) initiatives throughout the National Airspace System (NAS). Using FSM’s modeling and analysis capabilities, ATCSCC specialists evaluate a series of traffic management initiatives (TMIs), including airborne holding, Ground Delay Programs (GDPs), Airspace Flow Programs, and ground stops.
FSM provides a graphical and timeline-based display of airport and airspace demand and capacity, featuring powerful utilities for managing ground delays. Based on this display, users can determine whether a demand/capacity imbalance exists and can then cancel, delay, or reroute flights accordingly. FSM is designed to interact seamlessly with FAA and airline systems and displays Aggregate Demand List (ADL) information for both airport and airspace elements—ensuring that all stakeholders are referencing the same operational picture.
This study identifies and examines inefficiencies in the planning and execution of GDPs, potentially resulting from a lack of effective training. We propose that these inefficiencies could be mitigated through enhanced, simulation-based training. The analysis presented here uses a specific GDP inefficiency case to evaluate potential benefits and estimates the gains that may be realized by addressing the issue.
Although ATCSCC specialists are experienced and generally perform well in planning GDPs, inefficiencies still occur, sometimes leading to excessive delays. These delays often result from under-delivery at airports—where actual arrivals fall statistically short of the stated capacity during ground delay events. Simulation-based training could help mitigate this issue, reducing unnecessary delays for flight operators and yielding savings across the transportation system.
Significant research has addressed GDP planning and execution. Under-delivery has been identified as a persistent operational challenge. The term Flight Drift refers to the uncertainty in predicting estimated time en route (ETE) and departure time for flights operating under a GDP. This uncertainty can result in fewer flights arriving than planned, preventing full utilization of available airport capacity during constrained operations.
While many papers have addressed GDP optimization, the concept of using front-loading via a Blanket Adjustment has not been previously documented in the literature.
II. Operational Background and Analysis
This study compares arrival data with planned airport capacity during GDPs at six major airports. The airport data are sourced from the FAA’s Aviation System Performance Metrics (ASPM) dataset. This dataset includes quarter-hour interval data from May 1, 2015, to May 31, 2016, for the following airports: BOS, ORD, SFO, IAD, EWR, JFK, and LGA.
Although Dulles International Airport (IAD) was included in the dataset, no relevant GDPs occurred during the study period. Additionally, data from Chicago O’Hare International Airport (ORD) were excluded due to a high number of overlapping ground stops, which significantly skewed the output. As a result, the study focuses on five airports.
Ground delay data were compiled at Mosaic ATM using information from the FAA’s National Traffic Management Log (NTML) database, accessed via Oracle Discoverer software. The data encompass 5,757 GDPs from January 2011 to May 2016. Of these, 417 events fell within the ASPM dataset’s scope and met criteria for inclusion.
The number of events analyzed at each airport varied based on availability and whether the GDPs began on a quarter-hour mark, ensuring alignment with ASPM data. San Francisco International Airport (SFO) had the highest number of qualifying events.
To isolate under-delivery issues, any GDP event that included a subsequent ground stop was excluded, as such events indicate that demand exceeded airport capacity regardless of actual arrival counts.
The analysis found that the arrival rate was statistically below the planned capacity at each of the five airports studied, as shown in Fig 1.
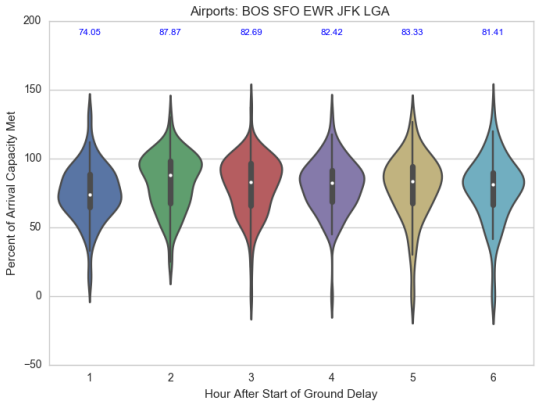
Fig 1. Violin Plot of Percentage of Capacity During Ground Delay Programs by Hour
We hypothesize that this under-delivery is due to GDPs being planned without any front-loading. Figure 2 illustrates the uncertainty surrounding arrival counts during GDPs. Operational variability—including push-back times, taxi-out duration, and en route flight time—introduces a distribution of actual arrival times around the planned schedule. While the deterministic plan aligns exactly with stated capacity, the real-world effect is a mean arrival count that falls below capacity.
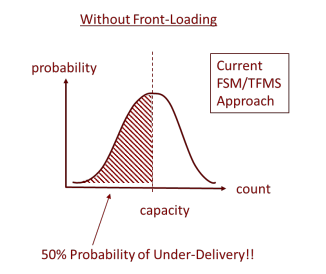
Fig 2. Notional Distribution of Planned Arrival Count in the First Time Interval of a GDP
However, if we assume that the error distribution is symmetric, this implies that the planned GDP inherently has a 50% probability of under-delivery relative to airport capacity. Given that the true error distribution of flight operations is skewed to the right, the actual probability of under-delivery is likely even higher than 50%.
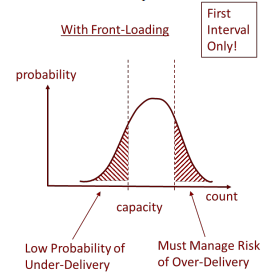
Fig 3. Notional Distribution of Planned Arrival Count in the First Time Interval with Front-Loading
Front-loading is a technique employed by some Air Traffic Management (ATM) decision-support and planning tools, such as the Time-Based Flow Management (TBFM) system. It involves scheduling a small number of additional flights during the initial interval of the program to create a buffer of demand at the airport. This buffer helps ensure that minor errors in the planning process do not result in lost slots or underutilized capacity. The “TRACON Buffer” parameter in TBFM limits the amount of delay that can be absorbed within the TRACON, preventing over-delivery.
While TBFM uses a direct front-loading method via the TRACON Buffer, FSM does not have an equivalent built-in capability. However, Traffic Management (TM) specialists could be trained to apply similar strategies manually. Specialists must manage the risk of over-delivery by applying a front-loading factor that does not exceed the delay that can be safely absorbed before aircraft reach the constrained airport.
In TBFM, the TRACON Buffer represents the delay (in minutes) that can be mitigated through vectoring and speed control within the TRACON. For a GDP, this buffer could be larger since delays can also be absorbed in ARTCC metering sectors. TBFM can assist in managing this extended delay scope.
The first approach a specialist might use in FSM is to apply a slightly higher rate than the stated airport capacity during the first GDP interval. However, this requires careful calculations to avoid exceeding safe delay thresholds. A drawback of this approach is that arrivals remain distributed over the interval, meaning the risk of under-delivery persists—especially early in the interval.
The second approach involves using a Blanket Adjustment, a lesser-known FSM feature. Our analysis of FSM usage data from 2011 to mid-2016 reveals that this function was used only 22 times out of 15,904 FSM events.
III. Conceptual Application of Simulation-Based Training
ATCSCC traffic managers are primarily responsible for modeling and publishing FSM-related TMIs. Consequently, field facility Traffic Management Coordinators (TMCs) receive minimal FSM training and are less likely to engage in GDP parameter development
Simulation-based training could provide targeted, high-quality instruction on FSM capabilities. TMCs would model GDP parameters (e.g., rate, scope, time frame) and analyze outcomes using fast-forward and rewind tools. This hands-on approach improves both confidence and participation during real-world GDP negotiations.
FSM/GDP Training Simulation Features
- Scenario Background: Provides planning context, including weather and traffic constraints.
- GDP Options: Prompts users to model the GDP discussed in the planning telcon.
- GDP Negotiations: Users revise models based on simulated feedback.
- GDP Activation: Simulation publishes the GDP and runs the scenario. Students can pause, rewind, or revise parameters.
- Simulation Disruptions: Introduces operational issues requiring adaptive responses.
- Simulated Human Factors: Simulated calls and distractions to mimic real-world complexity.
- Simulation Conclusion: Students receive a performance score and feedback dashboard.
Successful completion improves understanding of FSM tools and GDP strategies, ultimately increasing NAS operational efficiency.
IV. Analysis of Potential Benefits
To evaluate simulation-based training benefits, historical GDP data were analyzed to quantify under-delivery. Arrival and capacity data were sourced from the FAA’s ASPM database.
To select the most accurate arrival metric, we compared ASPM arrival types against FAA SWIM Terminal Data Distribution System (STDDS) values. The ETMS arrivals metric showed the closest match to actual arrivals and was used for further analysis.
We then developed a model to calculate excess delay minutes during the first three hours of each GDP. The model assumes:
- 1 flight per minute capacity.
- Each missing flight generates one minute of delay in subsequent intervals.
- Demand exceeds capacity (a safe assumption during GDPs).
- Delay starts accumulating in the following interval after under-delivery.
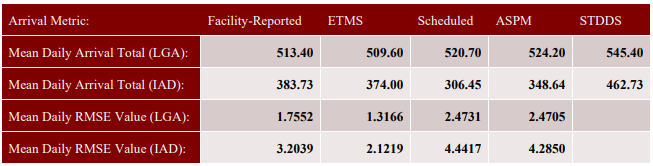
Table 1. Comparison of Arrival Metrics
The calculated delay savings were converted into annual cost savings using a direct operating cost of $50 per minute per flight. Results are shown in Table 2.
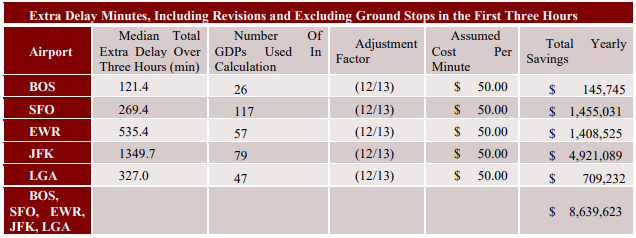
Table 2. Estimated Potential Benefit of Enhanced Traffic Management Training for the GDP Use Case
V. Conclusion
Simulation-based training for GDP planning could yield over $8 million in annual savings based solely on the GDP use case. This conservative estimate does not account for additional use cases identified during the study, which could further increase the benefit. Thus, the $8 million figure should be viewed as a lower bound, underscoring the high potential value of implementing simulation-based training across the NAS.
References
- Ball, M. O., Hoffman, R., Odoni, A., & Rifkin, R. (1999). The static stochastic ground holding problem with aggregate demands (Technical Report RR-99-1). NEXTOR, UC Berkeley.
- Ball, M. O., Hoffman, R., Knorr, D., Wetherly, J., & Wambsganss, M. (2000). Assessing the benefits of collaborative decision making in air traffic management. Proceedings of the 3rd USA/Europe Air Traffic Management R&D Seminar.
- Bhogadi, N., & Ball, M. O. (2002). Modeling demand uncertainties during ground delay programs (Master’s thesis, NEXTOR MS 2002-2).
- Ball, M. O., Vossen, T., & Hoffman, R. (2001). Analysis of demand uncertainty effects in ground delay programs. Proceedings of the 4th USA/Europe Air Traffic Management R&D Seminar.
- Liu, Y., & Hansen, M. (2013). Ground delay program decision-making using multiple criteria: A single airport case. Proceedings of the 10th USA/Europe Air Traffic Management R&D Seminar.
- Manley, B., & Sherry, L. (2008). Impact of ground delay program rationing rules on passenger and airline equity. Proceedings of the 3rd International Conference on Research in Air Transportation.