At the time of this blog post, the world is coming to grips with the outbreak of the Coronavirus, but the application of combatting supply chain disruptions with analytics goes well beyond Spring 2020. This post features project excerpts from our sister company, Mosaic Data Science.
Data Science Helps Firms Operate More Efficiently
As the corporate world becomes increasingly more globalized, it is not uncommon for a company to move a finished product through multiple parts of the world before it lands in a customer’s hand. The increased complexity might be daunting to some managers, but from a data scientists’ point of view, these flows produce a ton of information that is ripe for analysis and can enable discovery of new opportunities. Customers now expect a certain level of service, and companies need to manage a complex network of plants, providers, suppliers and buyers that enable them to remain flexible, operate efficiently, and meet customer demand.
Over the past few years, external shocks have caused significant corporate supply chain disruptions and what has become increasingly apparent to these firms is the need for access to real-time, actionable information. Collecting data, running descriptive statistics, and producing a view of ‘what happened’ is a great start, but when a disruption such as the COVID-19 outbreak hits the world, this approach will only confirm the disruption your suppliers, employees, & customers are feeling. A disruption such as COVID-19 or an earthquake comes on fast, leaving businesses scrambling to continue operations in a high-risk environment. Companies who embrace data analytics will have a significant leg up on those who do not.
Data science techniques, specifically predictive analytics, machine learning, & artificial intelligence, allow firms to fortify their supply chains for such disruptions by way of accurate visibility, simulation, & automation. The ability to better foresee the future, anticipate and plan for future events and disruptions, and strategically reduce risks helps companies continue their operations in the face of disruptive events.
That all sounds great, but what are some actionable ways companies can do this? In the following blog post we will explore applications of advanced analytics in the supply chain.
Increasing Demand Forecasting Accuracy
With the sheer amount of data available to businesses, managers have no excuses not to be accurately capturing demand. Sure, there are fluctuations and spikes, but demand forecasts are foundational to a strong supply chain. Analyzing historical sales information and trending out this information in linear models is a start, but consumer demand depends on several other factors. Weather, competition, pricing, and SLAs are a few that come to mind and can be integrated with historical demand, and validated with supervised, unsupervised and online machine learning algorithms to more accurately predict future demand.
The secret to successful forecasting is to evaluate and iteratively improve forecast models that use different data sets and modeling approaches, over a deep set of historical data. This forecasting process should not be done in a vacuum; these models need to be refreshed with more data and tested for near, mid & long-term effects. A short-term forecast might be best to inform production & procurement decisions, while a long-term forecast would be best suited on plant & warehouse placement decisions. Companies that are committed to rapidly testing multiple algorithmic approaches are better able to understand their customer demand than those who build an ARIMAX model one time and use that as the basis for all of their production & distribution decisions.
Mosaic has been fortunate enough to work with two firms who understood the value of high-quality demand forecasts. One of our customers is in the hotel business & the other is a trucking operator. In each project, Mosaic tested & evaluated several different forecasting models and selected the algorithms that not only performed the best in terms of accuracy, but also in usability and in compute time.
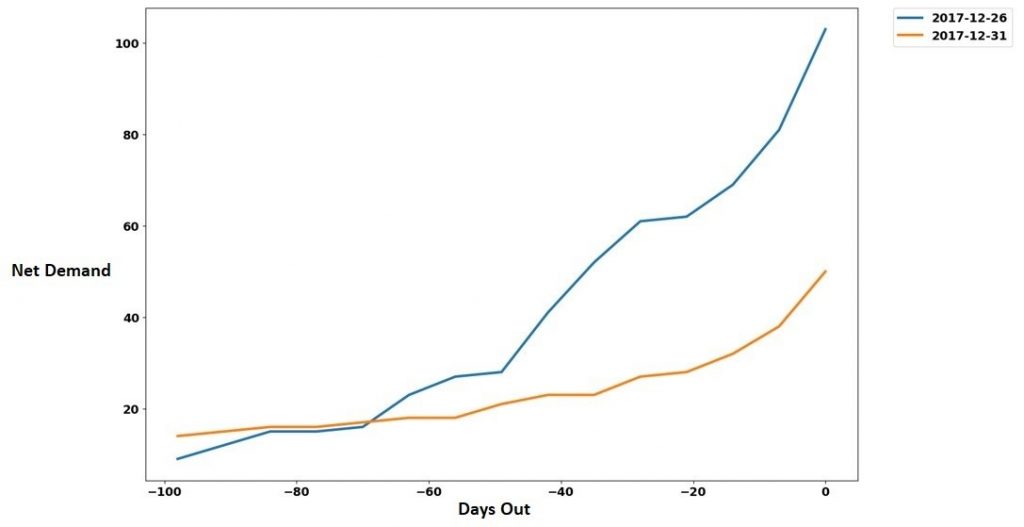
Forecasting Volatile Room Booking Demand
In the hotel project, our data scientists were faced with the objective of maximizing revenue from a resource with constrained supply (limited number of rooms) and fluctuating demand over time (nights of stay). This is a critical analytics task for hotels, as unoccupied rooms on a given night earn zero revenue, while demand in excess of room capacity carries a cost in terms of lost revenue. Through the course of the project Mosaic tested several different ML-based approaches, settling on a relatively new forecasting tool called Prophet developed by Facebook’s core data science team. Prophet begins by modeling a time series using the analyst’s specified parameters, producing forecasts and then evaluating them. When a problem occurs or poor performance is detected, Prophet, using an additive regression model, surfaces these issues to the analyst to help them understand what went wrong and how to adjust the model based on the feedback.
Our customer runs an enterprise-wide planning tool that runs on our forecasting model. This tool allows managers to experiment with prices, allocate resources more effectively, leading to a number of downstream positive effects on metrics and bottom line net income. Not only are decision-makers using data more efficiently, the analytics team gets another highly visible project win, inspiring more confidence in data science.
Identifying Time-Dependent & Seasonality Effects
The trucking company is one of the largest in North America, moving millions of products across the continent with a fleet of over 10,000 trucks. The company wanted to understand time-dependent trends in demand and to characterize demand patterns related to produce harvest seasonality. In collaboration with the trucking customer, Mosaic was able to analyze several different demand factors to identify watermelon produce season as having the largest impact on their demand.
Mosaic used predictive analytics to evaluate the time-dependent trends in the demand. This predictive analysis resulted in identifying consistent repeatable trends within the client’s order volume data, as well as a set of variables that could be used to predict these trends in the future. In the effort to confirm the existence and repeatability of the trend, Mosaic developed the predictive model using ARIMAX time series modeling to predict the future trends in the order volume. Other time series models such as ARIMA and time series regression were considered and evaluated. The ARIMAX model offered the best predictive capabilities because it leveraged trend information from the USDA along with produce-level data, and information from historic trends in demand. The ARIMAX model predicts weekly order volumes.
The ARIMAX model was tested, and performance metrics were calculated to measure how the model would perform when in use. The model performance was measured by MAPE (Mean Absolute Percent Error). The MAPE was an average of about 4%, indicating that the model would correctly identify trends in the demand with about 4% error in the number of predicted truckloads. This gives the trucking operator the ability to foresee changes in the demand trend a few weeks before the change occurs so they can plan for the predicted changes.
In both cases, our customers can predict customer demand much more accurately & efficiently than ever before. The ability to foresee effects on demand allows each to make decisions that fuel top line growth and/or promote substantial bottom line savings.
Simulating for Supply Chain Fortification & Optimization
As previously stated, globalization has stretched supply chains quite thin. Gone are the days of answering the question, how do I get product from point A to point B cheaply & efficiently. Today, these decisions are much more complex, how I do get one component from a plant in China loaded onto a container ship bound for Los Angeles, in time to meet production demand at an assembly factory in Texas, while passing customs and complying with local & federal regulations. Throw global supply chain disruptions in the mix and this process can become quite the headache.
Shipping, delivering & stocking inventory depends on getting every step in your supply chain right. Each link in the supply chain represents an opportunity for failure. The ability to model this entire process, run multiple simulations under different operating conditions allow managers to identify weak links, provide better visibility, improve customer service levels, and to identify cost-efficient policies and procedures (i.e., optimizing inventory levels), and evaluate the network’s robustness to various disruptions.
Supply Chain Simulation Optimization
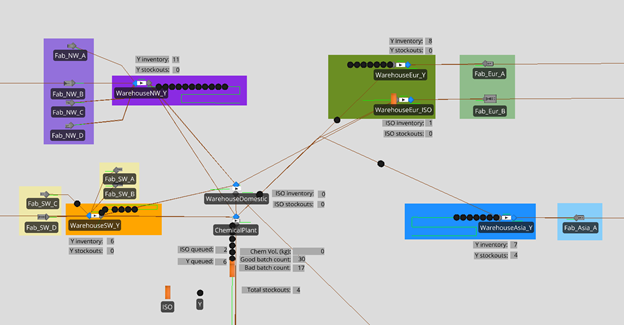
Mosaic has helped a manufacturer of electronic products fortify their supply chain against disruptions by way of algorithmic simulation. Our data scientists developed a powerful supply chain simulation complete with variable inventory policies for experimentation, a ‘pull’ system production process to accurately portray the in-place lean manufacturing strategy, and stochastic components to properly account for demand and delivery uncertainty. The process began with an in-depth mapping of our customer’s supply chain architecture to understand the frequency and nature of product orders allocated to the various fabrication facilities around the world.
This mapping effort included details of how the electronic materials company satisfied those orders through its worldwide network of warehouses, its international transportation logistics, and its product quality assurance and testing process.
Using an agile, customer-facing systems engineering process, our data scientists next began to iteratively design and develop a computer simulation to implement the details of the supply chain system. After careful design elaboration and incremental software deliveries, the partnership established three Key Performance Indicators (KPIs):
- Stockouts (a count indicating how many times the customer ordered a product and it was not available; lower numbers are better),
- Delivery times (a duration capturing how long the customer waited for an ordered product; lower durations are better), and
- On-hand inventory (frequency histograms that gave the data analytics team insights into how well inventory levels in the warehouses vary in response to supply and demand fluctuations).
For added value, Mosaic’s data scientists designed the simulation keeping a keen eye on flexibility and scalability. In the supply chain business, inventory can make or break net operating margins, and in the high-stakes semiconductor industry, material shortages that shut down the fabrication line are not an option. Supply chain simulation, if done correctly, affords the opportunity to theorize not only new inventory policies but also new inventory warehouses that can increase supply chain reliability and robustness to unplanned disruptions while reducing overall system costs. And it does so without the high risk and extreme cost of an actual physical implementation. Taking advantage of Mosaic’s flexible and scalable design, the partnership hypothesized several new warehouse alternatives for evaluation with respect to the aforementioned KPIs.
Mosaic’s data science consultants also developed an automated analysis report that can produce comparison charts, summaries, etc. These go straight to the business customer to allow them to compare performance under different inventory policies. Mosaic data scientists performed a thorough evaluation of the electronic material company’s supply chain through a careful experimentation regimen of various inventory policies, chemical quality levels, demand rates, and warehouse locations. For each scenario evaluation, Mosaic provided a suggested inventory policy and warehouse strategy, giving the electronics materials company more confidence in its supply chain performance and resilience. After delivering this simulation, Hurricane Harvey hit North America, but the manufacturer was well prepared because Mosaic had run simulations and fortified their supply chain well in advance.
Disruptions Happen
Global external shocks are going to continue to happen, that is a fact of operating a business in today’s environment. As companies embrace data science in their decision-making processes, they are better positioned to deal with these disruptions, allowing them to manage a risk-optimized supply chain. Companies who have deployed data science into their businesses will be poised to automate AI-driven decisions to even very sudden disruptions.