Mosaic believes there is an opportunity to develop a flight data analysis suite that helps aviation system stakeholders access, analyze, and present familiar data sources efficiently and effectively.
The Challenge
Many at Mosaic have worked in the aviation industry for several years now and have a good understanding of the various types of data available to evaluate and understand how the NAS operates. We know about adaptation data that frames the system, constraint data that limits how the system works, and flight surveillance data that shows us the current state of the system.
We would venture to say that many of us in the industry have a toolbox full of scripts and programs that parse, load, analyze, and view this data in either a static or sometimes in a dynamic form. When presented with a problem, like many others in the aviation industry, that needs to be researched, some of the first questions go something like:
- What data do I need?
- What data do we have?
- Where is the data?
- How do I process (parse/load) the data?
- How do I view the data?
One might go to the toolbox and reuse something done before or might even ask someone else in the industry what they know about the data source and whether they have any tools you could use to understand better what that source has to offer.
You may be thinking “should this data already be parsed and loaded into some mega database somewhere that one can use directly?” While it would be reasonable to think or expect that, that tool simply does not exist in the aviation world.
Current Work Completed at Mosaic
As mentioned previously, there have been several approaches discussed and even attempted in the past to develop this type of tool. A few Mosaic has developed:
- SODAA – Surface Operations Data Analysis and Adaptation – yes, it’s a mouthful, but it is one of the original NASA SBIR projects conducted by Mosaic. SODAA provides an adaptation editor for developing surface adaptations that support the Surface Decision Support System (SDSS).
- SDSS is used for terminal and surface runtime modeling. SODAA performs post-analysis by loading SDSS logs into a database that can then be used to view and analyze primarily surface data. In this model, we would capture logs for an airport and then manually (or for ATD-2) load that data into a database for analysis. Subsequent updates developed a more real-time approach that captures data from the Fuser (see below).
- Fuser – a centralized service for fusing/merging flight data from a variety of government, airline, and derived sources into a single integrated stream. This data is then used to support real time systems while also capturing this data into a relational database for post-event analysis. Additional detail about Fuser data sources can be found here.
- Several one-off projects capture and archive TFMData Flow Information data, weather data, and others.
- Commercial Services – Industry stakeholders have probably noticed and even used commercial offerings from companies like FlightAware or FlightRadar24 that capture historical flight data and sell the data. Access to single flights is easy, but the problem still exists that processing large amounts of bulk data will still require someone to develop a parser/loader/viewer which all have a TBD financial component.
Several years ago, our development team recognized this need and began creating some tools that support the wide-ranging requirements from a variety of projects but also started to address the significant problem of supporting ad hoc analyses. The basic pattern of developing a parser and loader has matured such that we have parsers and database loaders for many of the primary flight data sources we deal with (e.g., TFMData, SFDPS, TBFM-MIS, STDDS-SMES, STDDS-TAIS). Thanks to NCR and other projects, we also have parsers/loaders for many adaptation and constraint sources as well.
In the meantime, many analysts are left to their own devices. This means that on a project-by-project basis, they either develop the tools to parse/load data they require or if they know of one of the above tools, they try to leverage one or more of them.
Solving the problem with a Flight Data Analysis Suite
Mosaic is not in the business of selling data (at least not yet), but it seems that a software framework to support ad hoc flight data analysis is needed. Specifically, the aviation industry needs a tool or suite of tools that can parse, load, and view ingested flight data that can be easily analyzed. Users need the data to be organized and easily combined, at least visually, to allow an analyst to view adaptation, constraint, and flight data simultaneously at the same point in time. While the design and architecture should consider a playback capability, this is not a core component could be implemented in the future.
The first step is creating an inventory of the data and corresponding tools that Mosaic developed to date. At a minimum, this inventory would include the following data attributes:
- Data Source Name
- Source Description
- Archived Data – describes how much data is archived, where it is located, data quality, data gaps, etc.
- Parser – includes the implementer and a description of the parsing logic.
- Loader – includes the implementer and a description of the schema. In most cases, the tools should ingest everything the source offers and filter the data as needed using query tools.
The pattern of adding data sources and architecture should be simple and include:
- PostgreSQL/PostGIS Database Server
- An importer/loader that
- Knows where the archived sources reside
- Knows how to create databases/tables to store the data, and
- Knows how to populate the database/tables (based on a time range).
- The ability to use your favorite SQL tool to analyze the data.
- Take advantage of the geographic extensions in Postgres that:
- Extends the sources database tables with geographic types: points, line strings, polygons, etc.
- Manages or updates a GeoServer instance to provide access to the geo-referenced tables.
- Provides a web client that allows users to interact with the GeoServer and database to easily overlay sources on a map and add a general filtering capability.
A Recent Use Case
Under the SASE Project, an attempt was made to piece some of these concepts together. One of the research areas for the SASE project included reviewing Special Activity Airspace (SAA) and how it impacts flight operations. There were elements from all three data categories.
- Adaptation
- NASR (airports, runways and SUA definitions)
- SAMS (Special Use Airspace Management System)
- ERAM (SAA definitions)
- Constraint
- SAMS (Special Use Airspace Management System)
- SFDPS (Airspace Message)
- Surveillance
- TFMData
- SFDPS
Without going into the project-specific details for how this data would be analyzed, the ability to parse/load and view this data has applicability to many projects across the industry. In addition to populating a PostgreSQL/PostGIS database, this project configured a GeoServer, and developed a generic web client to allow adaptation data to be viewed. Through this effort, a lot was learned by just pointing your favorite SQL tool at the database and looking at the data in table and, more importantly, on a map.
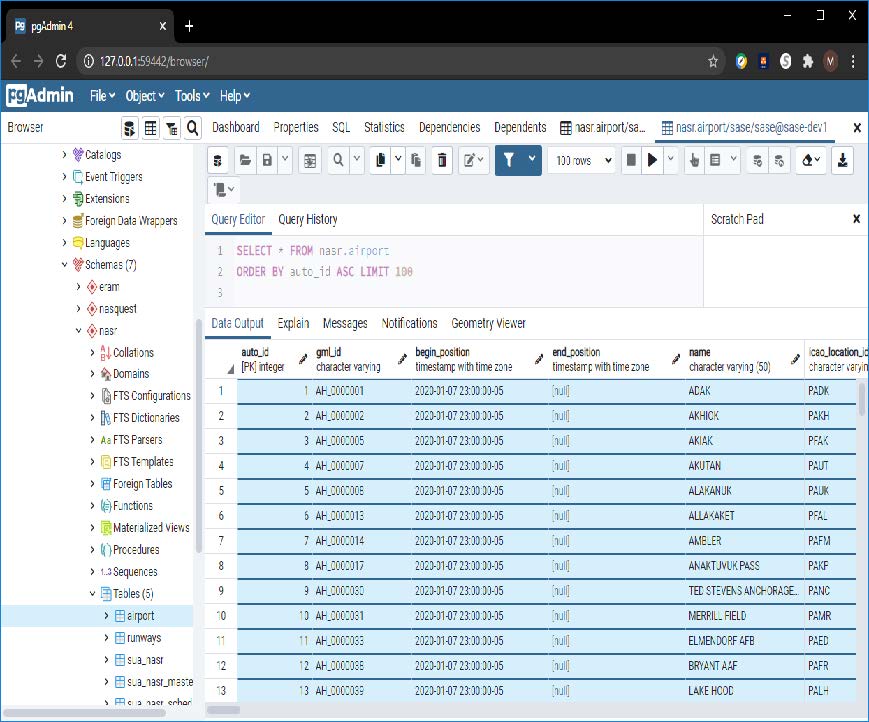
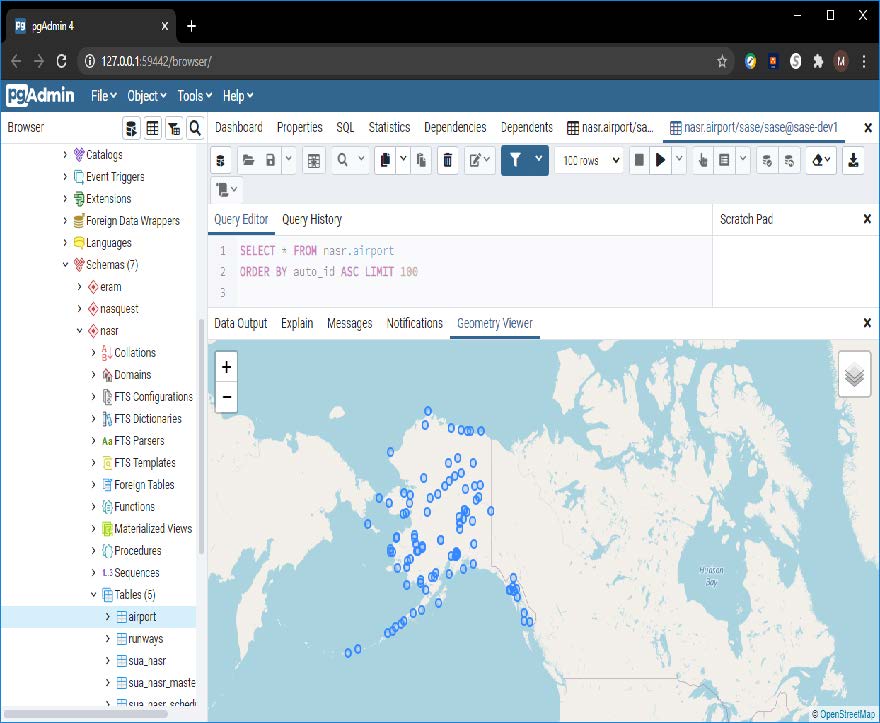
The two screenshots below are taken from an internal Mosaic system. The NASR airport data for a particular timeframe was parsed and loaded into a PostgreSQL/PostGIS database. Almost all attributes were mapped to a database table and a geometry column based on the airport’s location information was created. Both pgAdmin and dBeaver can exploit the geometry data in the database and overlay it on a variety of map backgrounds.
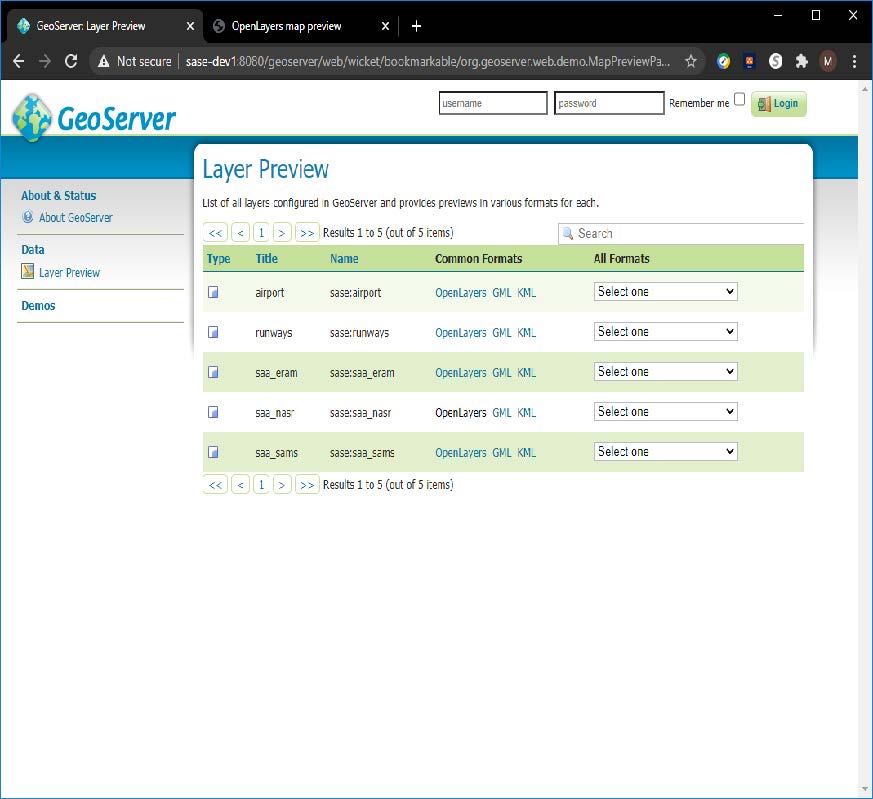
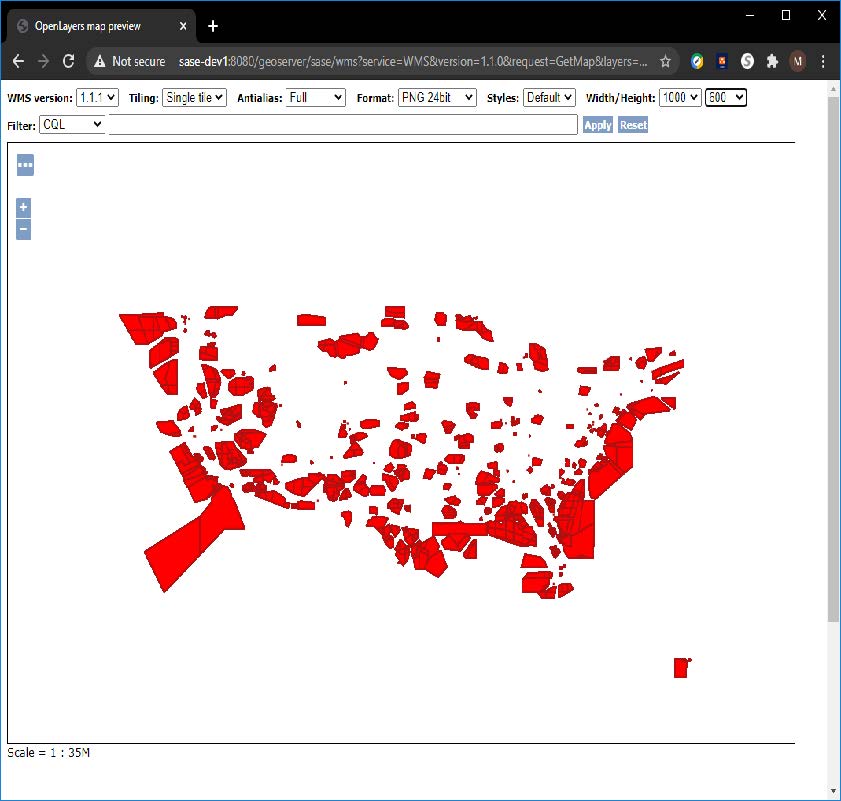
The screenshots below are from a GeoServer configured to use the same PostgreSQL/PostGIS database. In this case, the top image shows the layers that have been configured, and the picture below shows the SAA definitions. The database includes the text information for the SAA definitions and the geometry data and schedules for each SAA.
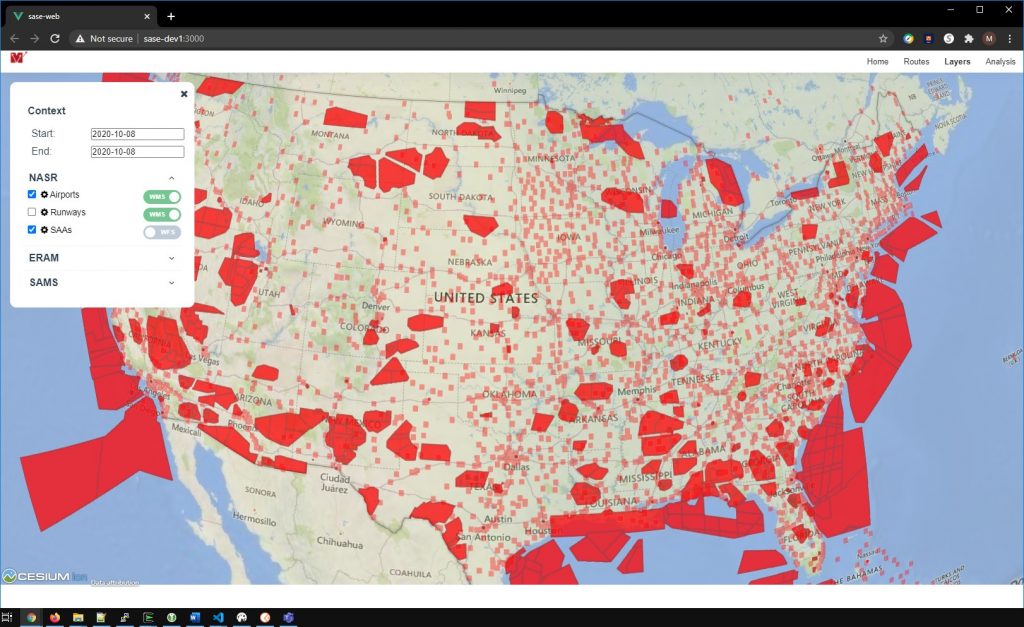
Finally, the image below is from the web client that uses the database and GeoServer to display multiple layers overlaid on a three-dimensional display. Included in the images are layers for Oct 8, 2020, for both airports and SUA definitions.
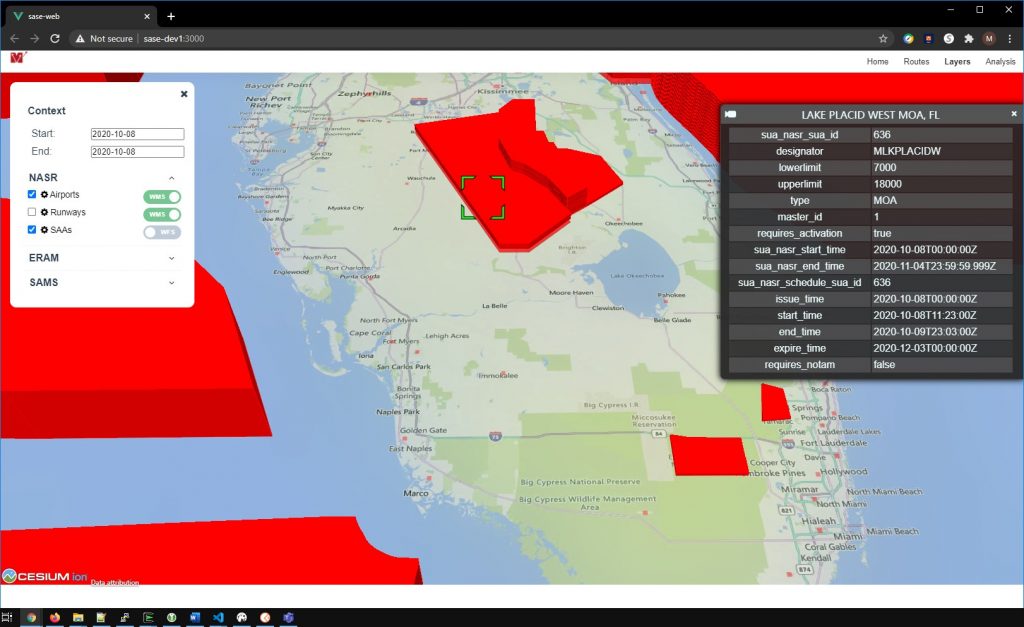
This second image is zoomed in and rotated to show the three-dimensional characteristics of the features and information for a selected feature: MOA MLKPLACIDW.
To further enhance this capability, two future steps would be to integrate the flight tracks from TFMData or SFDPS, or your desired surveillance source and overlay the flight tracks on the same map. Then a playback capability could be developed that shows active SAAs as flights navigate the airspace.
Time to build the flight data analysis suite
Fortunately, Mosaic has a large percentage of the components required to develop this type of capability and the know-how to integrate them into the framework described above. So, what would it take to do this? First and foremost, a plan with a well-defined pattern for how to create and add sources in a generic way is needed. Additionally, a strategy on how different users plan to parse/load/analyze these common sources. With this environment in place, Mosaic can provide aviation stakeholders with a flight data analysis suite that solves common problems.